IR
Our management remains committed to a focus on capital efficiency and shareholders to realize sustained growth and growth in corporate value.
Latest Materials
- Consolidated Financial Results for the Year Ended March 31, 2026 [Japanese GAAP][PDF:1,405KB]PDF file will open in a new window
- FY2025 Results (from April 1, 2025 to March 31, 2026)[PDF:1.7MB]PDF file will open in a new window
- FY2025 Results (for the Year Ended March 31, 2026) Supplementary Date[PDF:2.8MB]PDF file will open in a new window
- Audited Annual Financial Report 2025[PDF:1.66MB]PDF file will open in a new window
- NGK Report 2025[PDF:6.63MB]PDF file will open in a new window
- FY2025 Interim Business Report for Shareholders (From April 1, 2025 to September 30, 2025)[PDF:4.2MB]PDF file will open in a new window
Stock Price
TSE Prime 5333
Current price:
yen
Change from previous day:
Net sales
670 billion yen
Operating income
95 billion yen
Ordinary income
95 billion yen
Quarterly net income
60 billion yen
- *Source: "FY2025 Results (from April 1, 2025 to March 31, 2026) Supplementary Data."
Annual Shareholders' Meeting
Financial Results Briefing for Institutional Investors
Results Announcement
Continuing to meet investor expectations
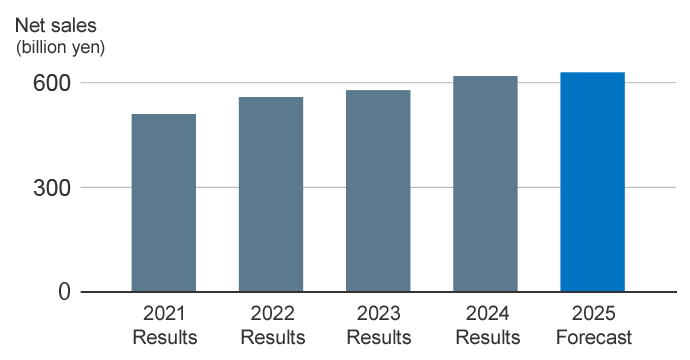 The vertical axis is in billion yen with gridlines at 0, 300, and 600; the horizontal axis shows results for fiscal years 2021 through 2025. The bars increase year by year: 2021 is the lowest at about 510, rising gradually through 2022 and 2023, exceeding 600 in 2024, and reaching the highest level of about 670 in 2025, indicating a steady upward trend.
- Operating income
- 95 billion yen
- Operating income margin
- 14%
- *Source: "FY2025 Results (from April 1, 2025 to March 31, 2026) Supplementary Data."
Steady progress is being made toward net-zero CO2 emissions.

- Global ESG investment index
- Selected for8consecutive years
To achieve sustainable growth and make contributions to society, the NGK Group will provide products and services that contribute to carbon neutrality and the digital society.


Search Products and Technologies


Inquiry about Investor Relations
Please apply with the contact form and give us your comments or questions.